Bloom Burton Healthcare Lending Trust
Growth & income strategy


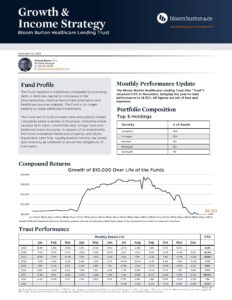
Fund Profile (Closed for Investment)
The Fund invested in healthcare companies by providing debt or debt-like capital to companies in the pharmaceutical, medical device/instrumentation and healthcare services markets. The Fund is no longer seeking to make additional investments.
The Fund lent to both privately held and publicly traded companies using a variety of structures, including senior-secured term loans, convertible debt, bridge loans and preferred share structures. In respect of its investments, the Fund considered intellectual property, real estate, equipment, cash flow, royalty/passive income, tax losses and inventory as collateral to secure the obligations of borrowers.
Latest Fund Reports
Counterparties & Terms
(Closed for Investment)
| Inception Date | Jul-15 |
| Management Fee | 2% |
| Performance Fee | 20% (annual) |
| Hurdle | 7% |
| Liquidity | Quarterly/ Bi-Annually |
| Lock Up | No |
| Currency | Canadian Dollars |
| Distribution | $0.70 per annum |
| Auditor | Goodman & Co. |
| Custodian | CIBC Mellon Trust Co. |
| Counsel | Baker McKenzie |
| Adminstrator | SGGG FSI |
| Registered Accounts | Eligible |
| Fundserv Code | BBI210(A) BBI220(F) |
Compound Returns
| Years | Year | January | February | March | April | May | June | July | August | September | October | November | December | Year-to-Date |
|---|---|---|---|---|---|---|---|---|---|---|---|---|---|---|
| 1 | 2023 | -4.3% | 0.4 | -3.9% | 1.0% | -0.5% | 0.9% | -2.7% | 2.4% | 1.4% | 0.7% | 0.5% | -7.2% | |
| 2 | 2022 | -7.0% | 11.7% | 0.7% | -2.6% | -11.6% | -14.1% | 2.3% | -6.1% | -8.6% | -3.0% | -5.4% | 8.5% | -32.4% |
| 3 | 2021 | -8.5% | 2.0% | -6.4% | 1.5% | -1.8% | -2.2% | -2.6% | 1.9% | -4.3% | 1.4% | -5.7% | -4.2% | -25.9% |
| 4 | 2020 | -1.0% | 0.9% | -2.2% | 0.9% | -1.0% | 2.7% | -14.7% | 22.0% | -5.1% | 4.4% | -1.9% | -3.0% | -1.7% |
| 5 | 2019 | 1.5% | -0.1% | 2.0% | 0.4% | 3.9% | 1.1% | -0.2% | -2.2% | -0.1% | -0.5% | -0.6% | 3.2% | 8.9% |
| 6 | 2018 | 4.6% | -2.8% | 3.6% | -1.5% | 1.9% | 2.6% | -1.7% | 6.0% | -0.1% | 0.7% | -1.1% | -0.8% | 11.7% |
| 7 | 2017 | -0.1% | 0.1% | 4.8% | -0.5% | -2.8% | -1.9% | -1.4% | 14.9% | 11.7% | 12.2% | 5.5% | 6.0% | 58.0% |
| 8 | 2016 | 0.4% | 0.0% | 0.1% | 0.1% | 0.8% | 0.1% | 0.7% | 0.4% | -1.8% | 0.6% | -0.5% | 0.2% | 1.1% |
| 9 | 2015 | ` | -0.2% | -0.3% | 0.0% | -0.1% | 0.2% | 0.4% | 0.0% |
*Partial Year